1973 Nobel Memorial Prize in Economic Sciences
Reason for Award
for the development of the input-output method and for its application to important economic problems
Laureates
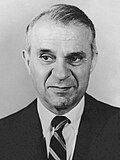
 Soviet Union
Explanation
In a town, a bakery buys flour, the flour mill buys wheat from farmers, and so on. Mr. Leontief put this “who buys what from whom” information into a big table. With the table, we can tell how much extra wheat and farm work is needed if more bread is sold. It shows, like falling dominoes, how one industry pushes others to move. Governments and companies can look at the table to decide which activities to support.
Related Keywords
input-output analysis
A quantitative method that describes how each industrial sector purchases intermediate inputs from, and sells outputs to, other sectors and final demand using matrices. Systematized by Leontief in 1941, it is compiled regularly by many countries under UN statistical standards. The framework estimates how demand shocks or policy interventions affect production, employment, and environmental loads, making it useful for industrial policy and life-cycle assessment. Because it is linear, computation is straightforward, but price changes and technical progress are hard to endogenize. Current research expands its scope by integrating Social Accounting Matrices and general equilibrium models.
Leontief inverse
Denoted (I−A)^{-1}, this matrix shows total output required per unit of final demand. Through its power-series expansion, it reveals the sum of direct, indirect, and recursive effects. Column sums give sectoral multipliers used to gauge economic ripple effects. The Hawkins–Simon condition ensures the matrix is finite and non-negative, implying system viability. In environmental extensions, Hadamard products with emission intensity vectors yield environmental footprints.
input-output table
A statistical table that records inter-industry transactions within a country or region for a base year. Rows represent supply, columns demand, with sections for intermediate sales, final demand, value added, and imports. Tables typically contain 30–400 sectors; analytical precision depends on this disaggregation. Data from surveys and business statistics are reconciled and balanced via methods such as RAS. Recently, multi-regional versions have been compiled to capture globalized supply chains, enabling researchers to compare circulation structures of the world economy.
multiplier effect
The chain-reaction phenomenon in which a rise in final demand for one sector spreads to production and income in other sectors. In IO models, column sums of the Leontief inverse quantify this multiplier. It is used to evaluate fiscal spending, export expansion, and regional revitalization scenarios. While conceptually akin to the Keynesian multiplier, the IO version focuses on physical inter-industry flows. To avoid overestimation, adjustments for import leakages and capacity constraints are required.
general equilibrium model
A theoretical framework in which many markets clear simultaneously, extending Walrasian equilibrium. Building a Computable General Equilibrium (CGE) model on IO tables allows prices and technology choices to become endogenous. This enables analysis of long-term impacts of trade policy or environmental taxes. Computation relies on numerical optimization and complementarity problem solvers. The Leontief fixed-coefficient model is a special case of CGE, and comparative studies between the two abound.
structural change analysis
A research area that quantifies how technical coefficients A and final demand y change over time, capturing shifts in industrial structure. Decomposition analysis separates demand and technology effects, widely used to explain carbon-emission changes. Methods include shift-share and matrix log-difference approaches. The Leontief framework enables clear attribution of policy contributions. Recently, machine-learning techniques have been combined to forecast coefficient changes in real time.
environmental input-output analysis
A technique that augments IO tables with energy use or emission coefficients to compute environmental burdens across product life cycles. It is used to address transboundary emission attribution and carbon-footprint measurement. The linearity of IO models enables exhaustive aggregation of hidden upstream emissions. However, the fixed-coefficient assumption may understate long-term technological change. Extensions integrating complex-systems models tackle temporal dynamics and uncertainty.